How does the use of the US Census and ACS dataset in the two options above reflect the six ideal characteristics of a dataset?
1. Is the dataset real?
2. Is the dataset interesting and relevant to students?
3. Is the dataset right sized?
4. Is the dataset complex enough?
5. Is the dataset from a reliable source?
6. Does the dataset provide context and variable definitions?


ESSENTIAL 4
What Makes a Good Dataset?
~30 Minutes
As a teacher, how do you know if a dataset will be good for engaging your learners in data and statistical practices and work towards meeting your learning goal(s) for a lesson or unit? Two characteristics of a good dataset were introduced in E.2 Transitioning to Experiences with Real and Bigger Data; they should be real and bigger. Here we elaborate on these and other characteristics that can afford opportunities for students to develop and use data and statistical practices such as processing, visualizing, and modeling. These
characteristics of datasets also have “pedagogical power” in that they give you an opportunity to develop students’ critical data habits such as considering variability, being skeptical, and considering sources of bias or errors.
When you are considering which datasets to use in your classroom, remember that, first and foremost, your students should be in the driver’s seat as much as possible. We propose characteristics of datasets that we think will help them have a fruitful and interesting journey, as well as times when they need to actually do some
maintenance under the hood (with the dataset) to be able to drive somewhere with it.

Datasets should be real. Authentic data could be generated by students (e.g., classroom-level polls,
experiments, sensors or probes, student-designed surveys), collected by students from online data
portals (e.g., IPUMS) or archival sites (e.g., Kaggle), or professional/government websites (e.g.,
National Oceanic and Atmospheric Administration, NOAA; NY Open Data) or curated by teachers and curriculum designers in authentic and trustworthy ways and made available in ready-to-use formats.
Datasets should be interesting and relevant to students. Datasets should have context or be
connected to an issue they may have prior knowledge about. Datasets, and the investigations and
discussions students do with the data, should not only be an opportunity for students to learn about the world around them, but should be connected to their daily lives and lived experiences. You have to get to know your students and your community context to know what is interesting and relevant to them.
Datasets should be the right size. The size of a dataset should be appropriate for the learning goal(s) and tools available. Don’t be swayed into thinking that all good statistics and data science learning
experiences need to be using professionally collected “big data” as used by professional data scientists. Just like the “Goldilocks” story, datasets should be just the right size (Rubin & Mokros, 2018). Big is
relative to your students, and to what you want them to learn. So the number of cases and number of variables you use should gradually get bigger. Early learners may use hands-on tools (e.g., stickers,
manipulatives like stacking cubes, pencil and paper) to experience smaller datasets of 1-2 variables and less than 30 cases. But, as a teacher, develop a habit of always asking how you can continually push
students further into a feeling of being “awash in data” so they have a sense of what real data work looks like (Erickson, 2017). Young learners in upper elementary school (ages 9-10) can begin to use
different technological tools to collect, explore, and visualize datasets. The types of technological tools can expand as they gain sophistication and are learning about different data and statistical practices. When possible, use tools that allow students to choose a random sample (of different sizes, perhaps) from a much larger dataset where they can choose the number of cases (sample size) and select which variables they are interested in for a particular question or issue. This gives them experience with bigger data, as well as how results from a random sample will vary from sample to sample.
Datasets should be complex enough. There should be enough complexity to allow for wondering about, and exploring, different relationships and trends. This complexity occurs when there are multi-ple variables and different variable types (e.g., categorical, numerical, geographical). Complexity also occurs when there may be errors or missing values in the data. With complex data, students have to make choices and decisions that will impact their analysis, modeling, and any claims made with the data (Krumhansl et al., 2016). With multiple variables, students need to choose which variables to attend to for investigating a particular question. But yet, by having other variables still present in the dataset,
students can act on wonderings that may emerge about how additional variables may be related to, or be able to help explain, trends they notice within the primary variables they are investigating. This
complexity also allows teachers to use a dataset to meet a more robust set of learning goals. For
example, a dataset that contains categorical and numerical variables allows for learning and applying models for comparing groups as well as associations among quantitative variables and categorical
association. If students have to make decisions about how to handle missing data or what may be an
error in data entry (e.g., 7.5 listed for foot length that is supposed to be measured in centimeters), they get to experience how authentic data practices are done.
Datasets should come from a reliable source. Using real and bigger data means that educators are either asking students to design mechanisms (e.g., surveys, experiments) that will collect much
larger datasets, or they have students use datasets that have been collected by others. Trustworthiness of data is paramount. Considering the source of data is an important data and statistical practice. The modern student needs to gain experience with datasets from reliable sources such as government
agencies (e.g., US Census Bureau), research institutes (e.g., Pew Research Center, Gulf of Maine
Research Institute), professionally archived data sites, citizen science or student-generated data on a large scale (e.g., CitizenScience.gov; US Census at School), or other data-generating sites such as social media, online games or simulations. The original source of a dataset, and who may have processed,
archived, cleaned, or prepared the data for educational purposes is important to consider. If the dataset
is in curriculum materials, be sure the source is documented.
Datasets should have contextual information and variable definitions. In order for a dataset to be truly usable by people who were not directly involved in the collection/generation process of producing a dataset, there needs to be enough documentation to help contextualize the data so users can come to understand where and how the data was originally collected. Datasets that provide enough contextual information and variable definitions are an indicator of how reliable and trustworthy the source may be. Many larger and public datasets include many variables with labels that are often an abbreviation. Read-ing the “code book” or “data dictionary” is an essential part of using data from other sources. To be us-able, not only is it important to know the complete name for a variable, but to also understand what and how the measurements were taken. Understanding these measurements may mean doing some dig-ging into related sources about the data collection context.
1.
2.
3.
4.
5.
6.
Six Ideal Dataset Characteristics
Working with a Dataset with Ideal Characteristics
Every year the U.S. Census Bureau collects data from a random sample of households for the American Community Survey [ACS]. This survey is part of the decennial census and actually replaces the much
longer form that was used in the census survey every 10 years. The ACS is intended to give a more up-to-date picture of issues in the lives of people living in communities across the U.S. that can be used to assist decision-makers (learn more about the questions on the ACS). Just like responses to the census survey, responses to the ACS are confidential and are never released to other government agencies. Once the data is de-identified, it is aggregated into datasets that are made available for public use. Many educators and curriculum developers have also used the ACS data to create data investigation experiences for learners.
Choose one of the options below. As you engage, think critically about how the data from the US Census and ACS is being made available to students. Consider how the dataset meets the six characteristics described above.
APPLY
Option 1: Generate a random sample from the ACS with CODAP
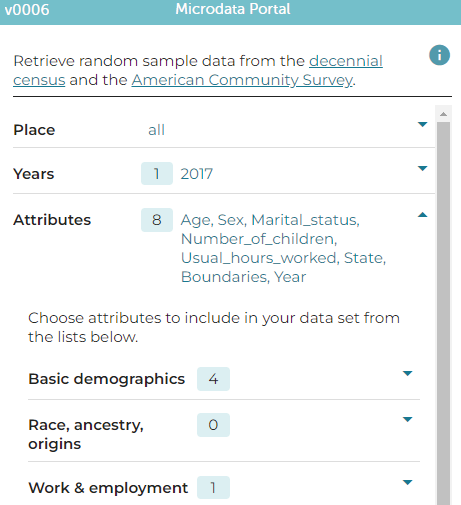
A recent curriculum development project, Investigating US Society with Data, worked with the developers of CODAP to create a method that allows users to select a random sample of data from a large collection of data from the US Census and the ACS, from 1920 through more recent years. You can learn more about their curriculum in this brief video and see a sample lesson plan in Extended Resource 6
Open the Microdata Portal in CODAP and explore the options for
which time period(s), geographical region(s), and variables can be
selected for a sample. Notice that there is an option to view the
descriptions for each variable. You can choose what you may be
interested in exploring, but here are a few questions that may guide
your variable selection.
From what parts of the world do immigrants living in the U.S
come from? Has this changed over time (e.g., compare 1920 to
2017)?
How many children are typically living in an American household
(at the time of the survey)? Has this changed over time? Is it
different across racial-ethnic households?
How has the level of educational attainment changed over time?
Is this related to other demographic factors or income levels?
Option 2: Explore data visually through maps in Social Explorer
Instead of students directly generating and manipulating data to perform their own investigation, some
educators have used the US Census and ACS data to create learning modules that engage students by
interrogating data shown on maps to consider trends and relationships. Curriculum developers at Social
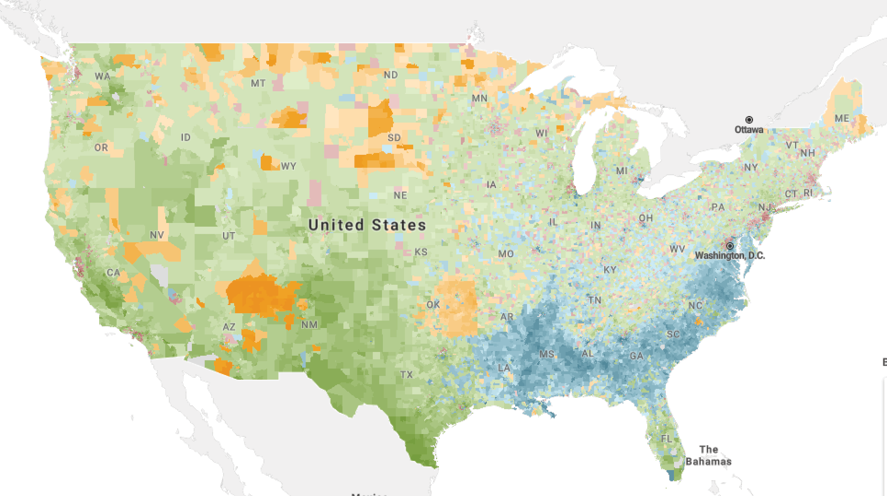
Explorer have created a series of free brief modules that allow students to learn with and from data in an easy to use visual, map-based interface. Image shows US map in Social Explorer with counties colored by largest minority group.
Open the Teaching and Learning support at Social
Under Lecture Launchers, choose the
Geography section and then the Diversity
and US Cities module (or go directly to that
module here). (later you could choose one
of the Lecture Launchers or Data Snack
modules that may interest you. For example,
Navigate through the slides and interact with the maps to explore the distribution of different racial groups across America.
Bargagliotti, A., Franklin, C., Arnold, P., Gould, R., Johnson, S., Perez, L., & Spangler, D. (2020). Pre-K–12 Guidelines for assessment and instruction in statistics education II (GAISE II). American Statistical
Association and National Council of Teachers of Mathematics. https://www.amstat.org/asa/files/pdfs/GAISE/GAISEIIPreK-12_Full.pdf
Erickson, T. (2017). Smelling like data science. Blog post February 21, 2017. Online https://bestcase.word-press.com/2017/02/21/smelling-like-data-science/
Gebre, E. H., & Morales, E. (2020). How “accessible” is open data? Analysis of context-related
information and users’ comments in open datasets. Information and learning sciences 121 (1/2), 19-36. https://doi.org/10.1108/ILS-08-2019-0086
Finzer, W. (2013). The data science education dilemma. Technology Innovations in Statistics Education, 7(2). https://escholarship.org/uc/item/7gv0q9dc
Finzer, W. & Reichsman, F. (2018). Exploring the essential elements of data science education. @Concord 22(2), 8-9. Available online: https://concord.org/newsletter/2018-fall/exploring-the-essential-elements-of-da-ta-science-education/
Krumhansl, K., et al. (2018). Ocean Tracks- A journey through the ocean: A modern approach to science education. Scientia Global. Available online. https://www.scientia.global/ocean-tracks-a-journey-through-the-ocean-a-modern-approach-to-science-education/.
Lee, H. S. (2013). Quantitative reasoning in a digital world: Laying the pebbles for future research frontiers. In R. L. Mayes & L. L. Hatfield (Eds.), Quantitative reasoning in mathematics and science education: Papers from an international STEM research symposium, WISDOM e Monograph #3 (pp.65-82). Laramie,
Wyoming: University of Wyoming College of Education. http://www.uwyo.edu/wisdome/_files/documents/Lee.pdf
Lee, V. R., Wilkerson, M. H., & Lanouette, K. (2021). A call for a humanistic stance toward K–12 data
science education. Educational Researcher, 50(9), 664-672.
Rubin, A., & Mokros, J. (2018). Data clubs for middle school youth: Engaging young people in data science. In M. A. Sorto, A. White, & L. Guyot (Eds.), Looking back, looking forward. Proceedings of the Tenth
International Conference on Teaching Statistics, Kyoto, Japan. Available online at https://iase-web.org/icots/10/proceedings/pdfs/ICOTS10_9B2.pdf
Rubin, A. (2021). What to consider when we consider data. Teaching Statistics, 43, S23– S33. https://doi.org/10.1111/test.12275
References:
REFLECT


EXPERT INSIGHTS


