

ESSENTIAL 4
Differences Between Statistics and Mathematics
Statistics and Data Science both use foundational concepts and skills from mathematics, such as
algorithms, expressing relationships in functions and formulas, modeling phenomena, probability, and
representing data on a number line or in a coordinate plane. In most countries, including the US, statistics skills and concepts are taught within mathematics departments in K-12 school curriculum. Additionally, data science courses being offered in high schools are often taught by mathematics or computer science
teachers. Data science involves a heavy dose of both statistics and mathematics, along with computational skills. In this brief video [3:42 min], Susan Friel, Webster West, Hollylynne Lee, and Christine Franklin
discuss what they see as key differences between mathematics and statistics.

~15 Minutes

There are subtle differences between mathematical and statistical reasoning. In statistics, we use
mathematical tools, including probability, in solving problems with data. However, we rely heavily on data and context in statistical reasoning. Questions in statistics and data science begin with a context from which individuals must make decisions about how to collect or curate data to investigate problems. In some situations, data are already collected, and statistical questions can be developed based on one’s interest(s) related to the dataset. In all situations, it is impossible to make sense of a statistical problem without
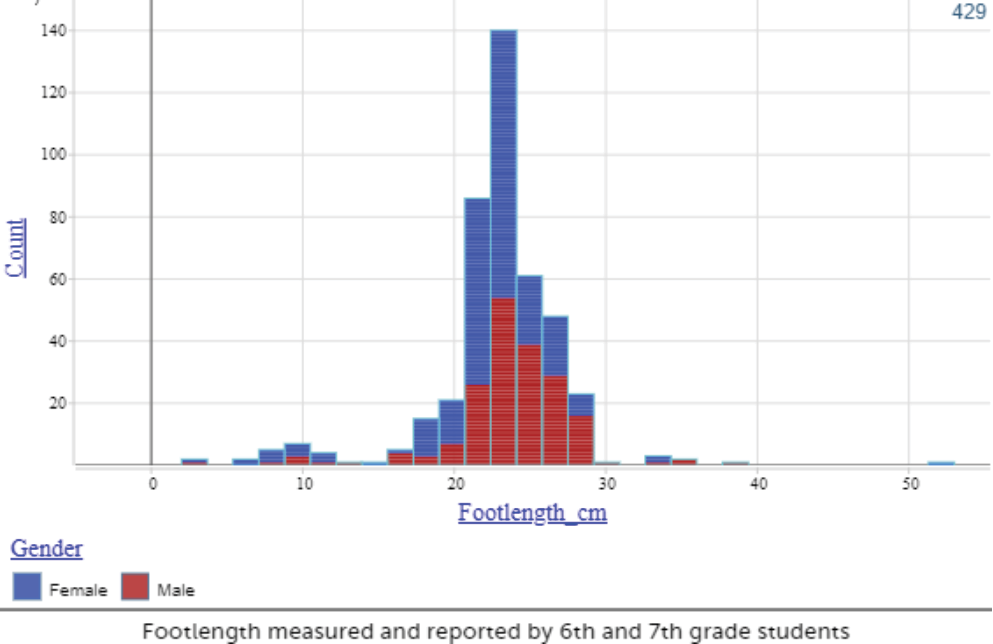
knowing details of the situation surrounding the data. The context can help shed light on why there might be outliers or particular clusters within a distribution or whether we should exclude outliers or anomalies. For example, when examining the typical value of foot length, one can identify outliers by looking at
distribution of foot lengths. The age of the people whose foot was measured (in centimeters) may make a significant contribution to understanding how data values vary and may be clustered. Knowing that the data is from a random sample of 6th and 7th grade students (typically age 11-13) who measured and
reported their foot length as part of an online questionnaire (Census at School) can be helpful in interpreting the shape of a distribution with a cluster and a few data values appearing far outside of the typical range of values. In the graph shown, most students report foot lengths between 20-26cm, but one may wonder about the reported foot lengths around 10cm or 50 cm. A decision may need to be made as to whether to exclude any values in the analysis and interpretation of findings.
The issue of measurement is another important distinction between statistics and mathematics. In
mathematics, measurement typically refers to understanding units and precision in problems that deal with most concrete measures such as length, area, and volume. But, in statistics, measurement can be a bit more abstract. For example, when considering how you might measure intelligence or a city’s pace of life, there is not a straightforward method. Instead, researchers and statisticians have to decide how to best measure what is being studied and often do so in different ways. When working with a data set collected by someone else, it is imperative to understand what was being measured and the range of values that would make sense for the context. Without this understanding, it is impossible to make meaningful
interpretations of trends or relationships in data or to spot when values should be considered anomalies or outliers or even values that don’t make sense and should be considered erroneous (e.g., a time of 07
entered for seconds to run a quarter mile, or 8cm for foot length of a preteen--which is about 3 inches).
Variability and the uncertainty of conclusions is another major difference between statistics and
mathematics. In mathematics, results are usually reached by means of deduction, logical proof, or
mathematical induction and typically there is one correct answer. Statistics, however, utilizes inductive
reasoning and claims made are always uncertain. This is largely due to the interpretation of the context and methods surrounding data collection and analysis. It also stems from the nature of variability in the world around us, and thus in data. For example, “How old are the teachers in my school?” is a statistical question expecting the variability in ages. One will need to decide where to get the data from (school teachers), to measure (age) and choose appropriate statistics (measures of central tendency or variation) and graphical displays to answer the question. In contrast, given a set of data points of teachers’ age and asking students to find the mean is not a statistical question since the answer is definitely a single number found using an algorithm. Another example in bivariate data is about fitting a linear function between height and weight. In mathematics, students are often asked to find a (deterministic) function through a set of points. In contrast, statistical questions focus on the level of certainty one can make when using a “best fit” function to
predict one variable based on the other. In particular, one considers how far such an extrapolation can be made based on the context and how much error is associated with the prediction (e.g., what deviations from the line are expected?).
In summary, some salient features that we attend to in statistical questions include the role of context, measurement, variability, and uncertainty. Mathematics serves as a tool to help investigate statistical
questions, but is not the only aspect of a statistics investigation that students should experience.
Tran, D., & Lee, H. S. (2015). The difference between statistics and mathematics. In Teaching Statistics Through Data Investigations MOOC-Ed, Friday Institute for Educational Innovation: NC State University,
Raleigh, NC. Retrieved from https://fi-courses.s3.amazonaws.com/tsdi/unit_2/Essentials/Statvsmath.pdf
ESTEEM. (2017). How is statistics different from mathematics? In Foundation in Teaching Statistics: Module 1.1 What is Statistics and How Should We Teach It?, Enhancing statistics teacher education with E-modules [ESTEEM], Friday Institute for Educational Innovation: NC State University, Raleigh, NC. http://go.ncsu.edu/esteem
This Document is Adapted From:
Variability and Uncertainty
Measurement
Data and Context

delMas, R. C. (2004). A comparison of mathematical and statistical reasoning. In B.-Z. Dani & J. Garfield (Eds.), The challenge of developing statistical literacy, reasoning and thinking (pp. 79-95). Netherlands:
Kluwer Academic Publishers. https://doi.org/10.1007/1-4020-2278-6_17
Franklin, C., Bargagliotti, A., Case, C., Kader, G., Scheaffer, R., & Spangler, D. (2015). Chapter 3: The
mathematical practices through a statistical lens. In C. Franklin et al. (Eds.) The statistical education of
teachers (pp. 9-12). American Statistical Association. Available at http://www.amstat.org/asa/files/pdfs/EDU-SET.pdf
Rossman, A., Chance, B., & Medina, E. (2006). Some important comparisons between statistics and
mathematics, and why teachers should care. In G. F. Burrill & P. C. Elliott (Eds.), Thinking and reasoning with data and chance: Sixty-eighth NCTM yearbook (pp. 139-150). Reston, VA: National Council of Teachers of Mathematics.
Scheaffer, R. L. (2006). Statistics and mathematics: On making a happy marriage. In G. F. Burrill & P. C.
Elliott (Eds.), Thinking and reasoning with data and chance: Sixty-eighth NCTM yearbook (pp. 139- 150).
Reston, VA: National Council of Teachers of Mathematics.
References:


